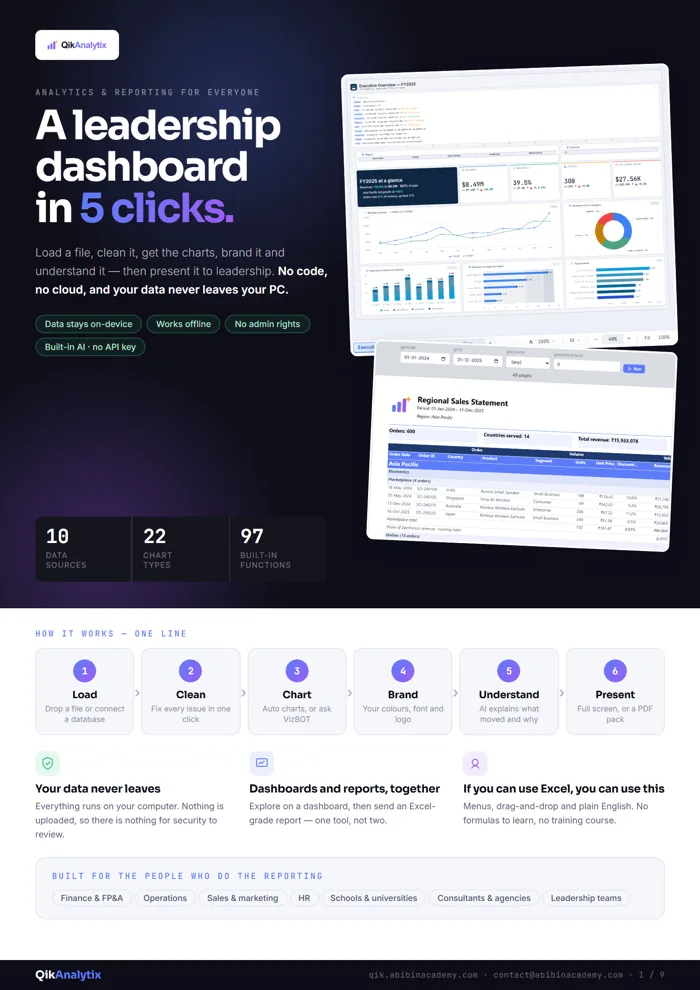
Load a file, clean it, get the charts, brand it and understand it — then present it to leadership. No code, no cloud, and your data never leaves your PC.
Analytics and reporting for everyone — not just the data team.
One desktop app that anyone can use. Explore on a dashboard, then send an Excel-grade report — menus, drag-and-drop and plain English. If you can use Excel, you can use this.
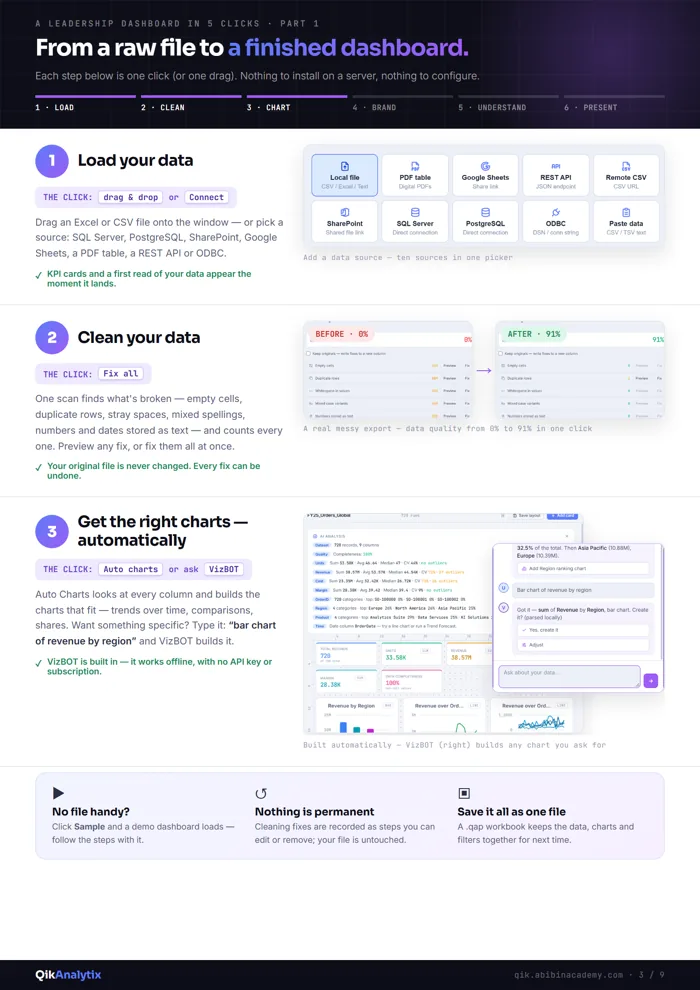
Drop an Excel or CSV — or connect SQL Server, PostgreSQL, SharePoint, Google Sheets, a PDF table or an API. KPI cards and a first read appear the moment it lands.
2Clean it in one go
THE CLICK · FIX ALL
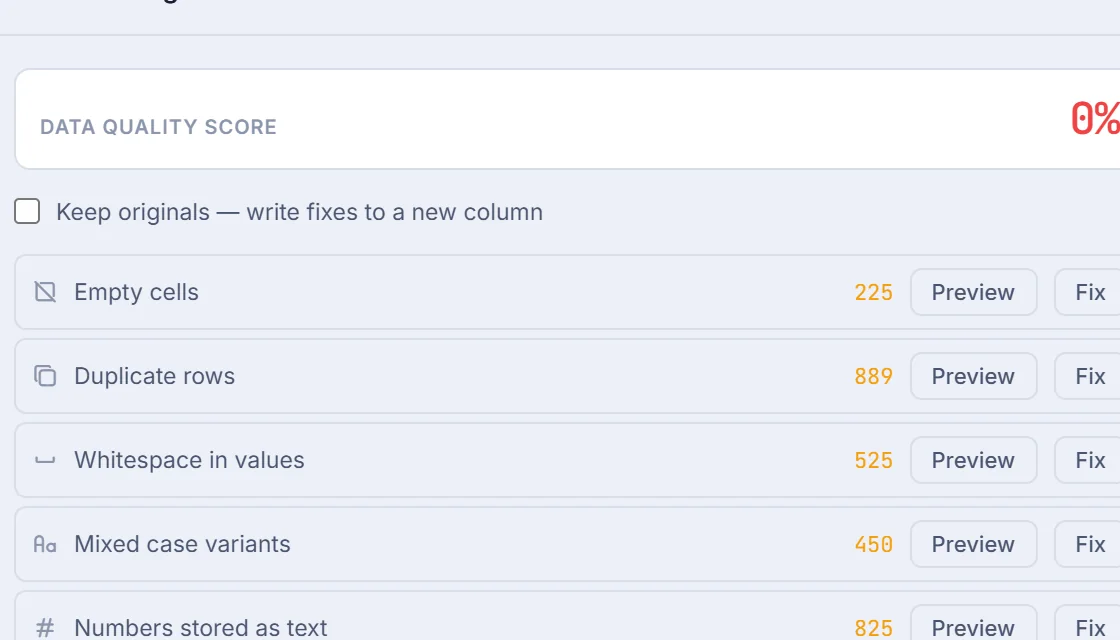
One scan finds empty cells, duplicates, stray spaces, mixed spellings, numbers and dates stored as text. Preview any fix — your original file is never changed.
3Get the right charts
THE CLICK · AUTO CHARTS
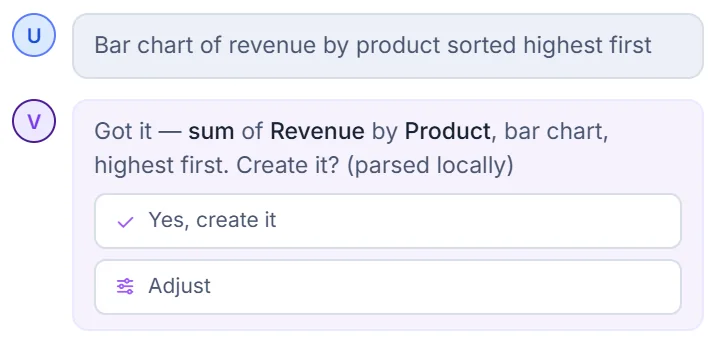
Auto Charts reads every column and builds the charts that fit. Want something specific? Type “bar chart of revenue by region” and VizBOT builds it.
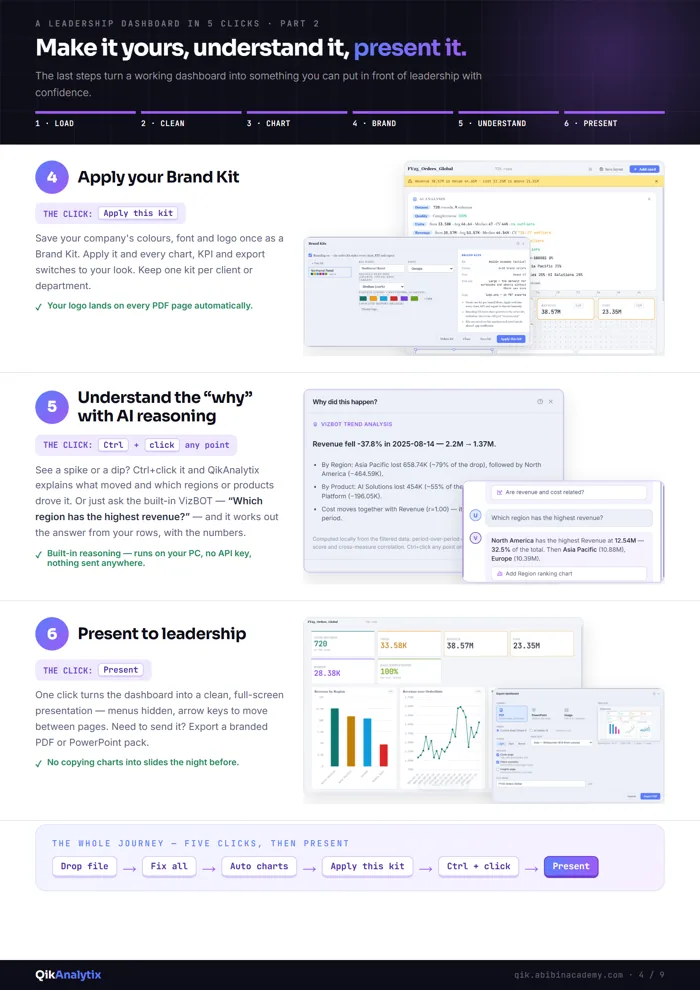
4Apply your brand
THE CLICK · APPLY THIS KIT
Save your colours, font and logo once as a Brand Kit. Apply it and every chart, KPI and export switches to your look — logo on every PDF page.
5Understand the why
THE CLICK · CTRL + CLICK
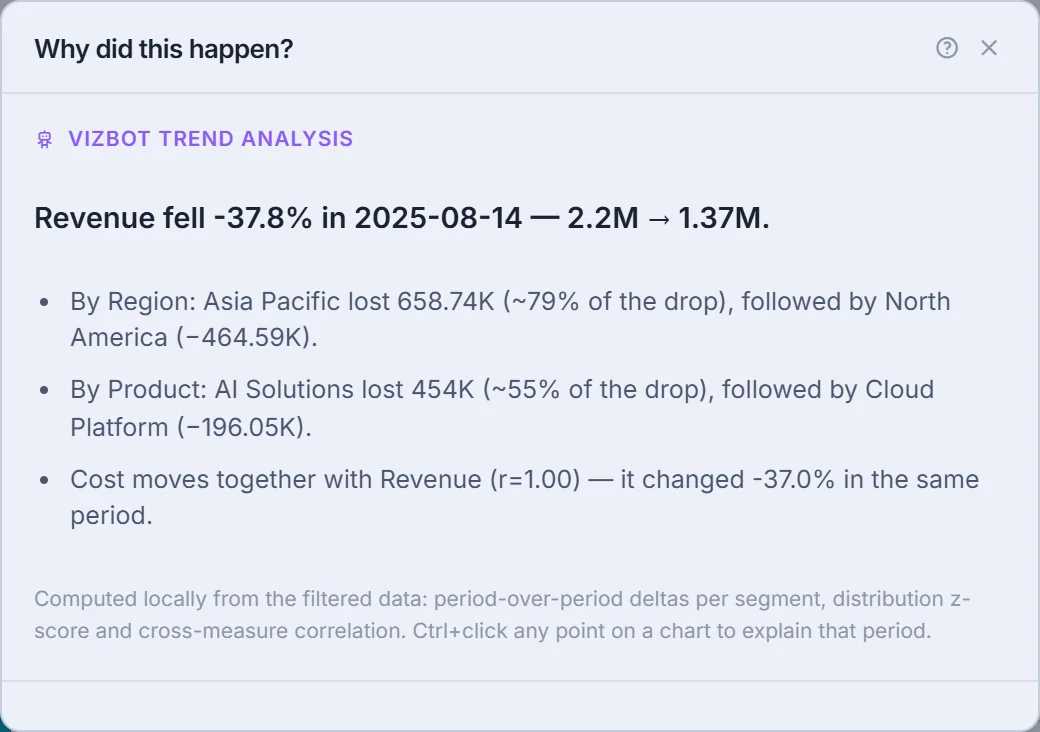
See a spike or a dip? Ctrl+click it and QikAnalytix names what moved and which regions or products drove it — computed on your PC.
6Present to leadership
THE CLICK · PRESENT
One click turns the dashboard into a clean full-screen presentation. Need to send it? Export a branded PDF or PowerPoint pack.
The problem we solve
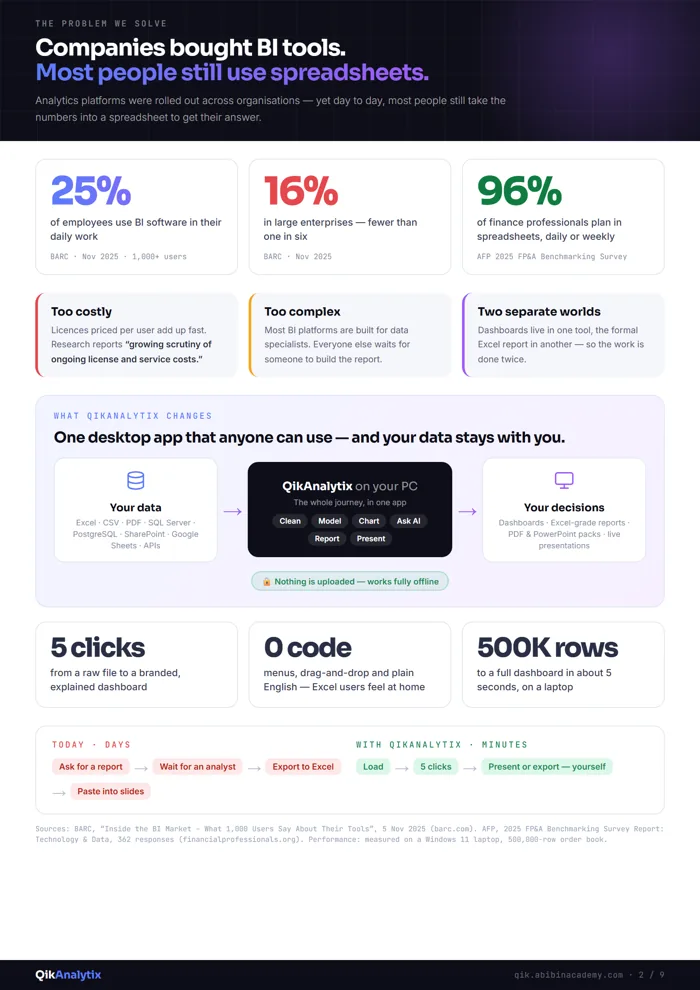
Companies bought BI tools. Most people still use spreadsheets.
Analytics platforms were rolled out across organisations — yet day to day, most people still take the numbers into a spreadsheet to get their answer.
25%
of employees use BI software in their daily work.
BARC · Inside the BI Market · Nov 2025 · 1,000+ users
16%
in large enterprises — fewer than one in six.
BARC · Nov 2025
96%
of finance professionals plan in spreadsheets, daily or weekly.
AFP · 2025 FP&A Benchmarking Survey
Today · days
Ask for a report→Wait for an analyst→Export to Excel→Paste into slides
With QikAnalytix · minutes
Load→5 clicks→Present or export — yourself
Product film
Welcome to your command center
Three minutes from a raw export to a branded, explained dashboard — real screens, nothing mocked. Watch it once and you'll know the whole app.
Real app, real dataLoad → clean → chart → brand → explain → presentOpen on YouTube
Intuitive experience, powerful features
Features designed for how you work
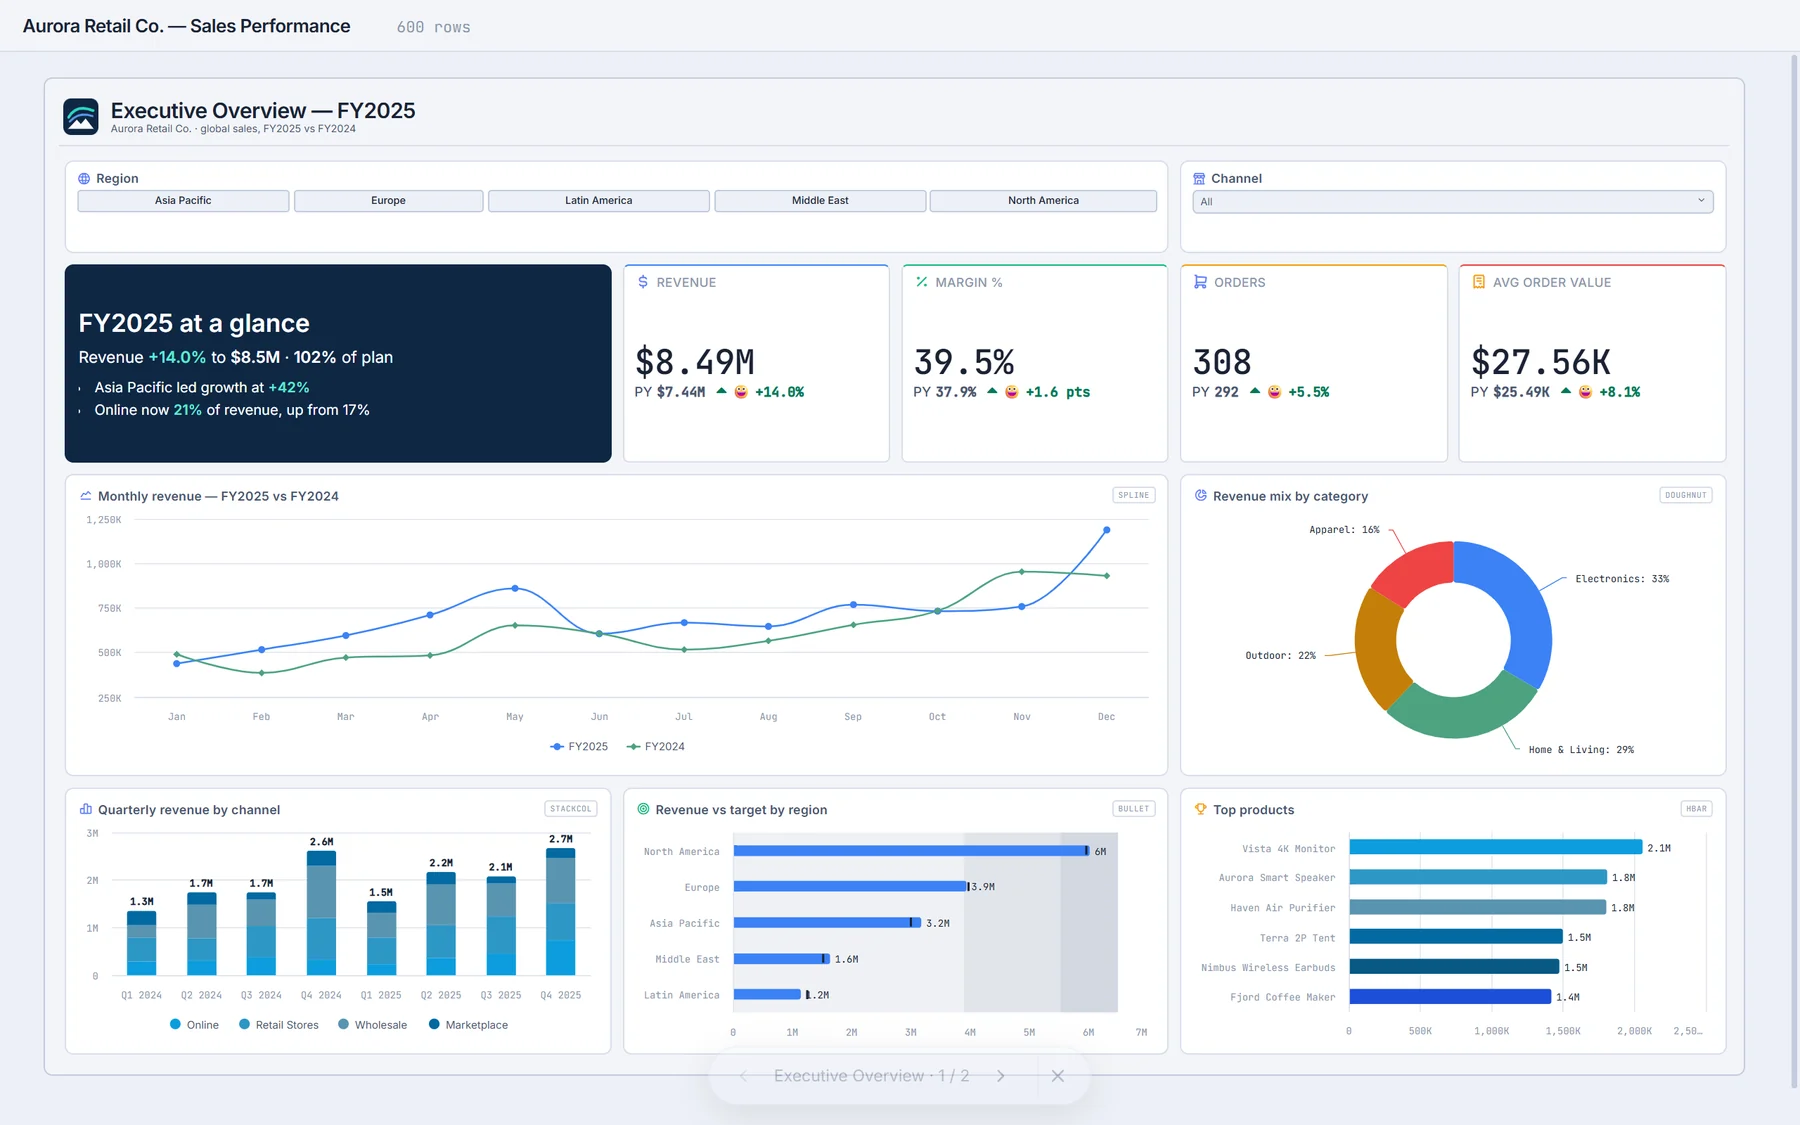
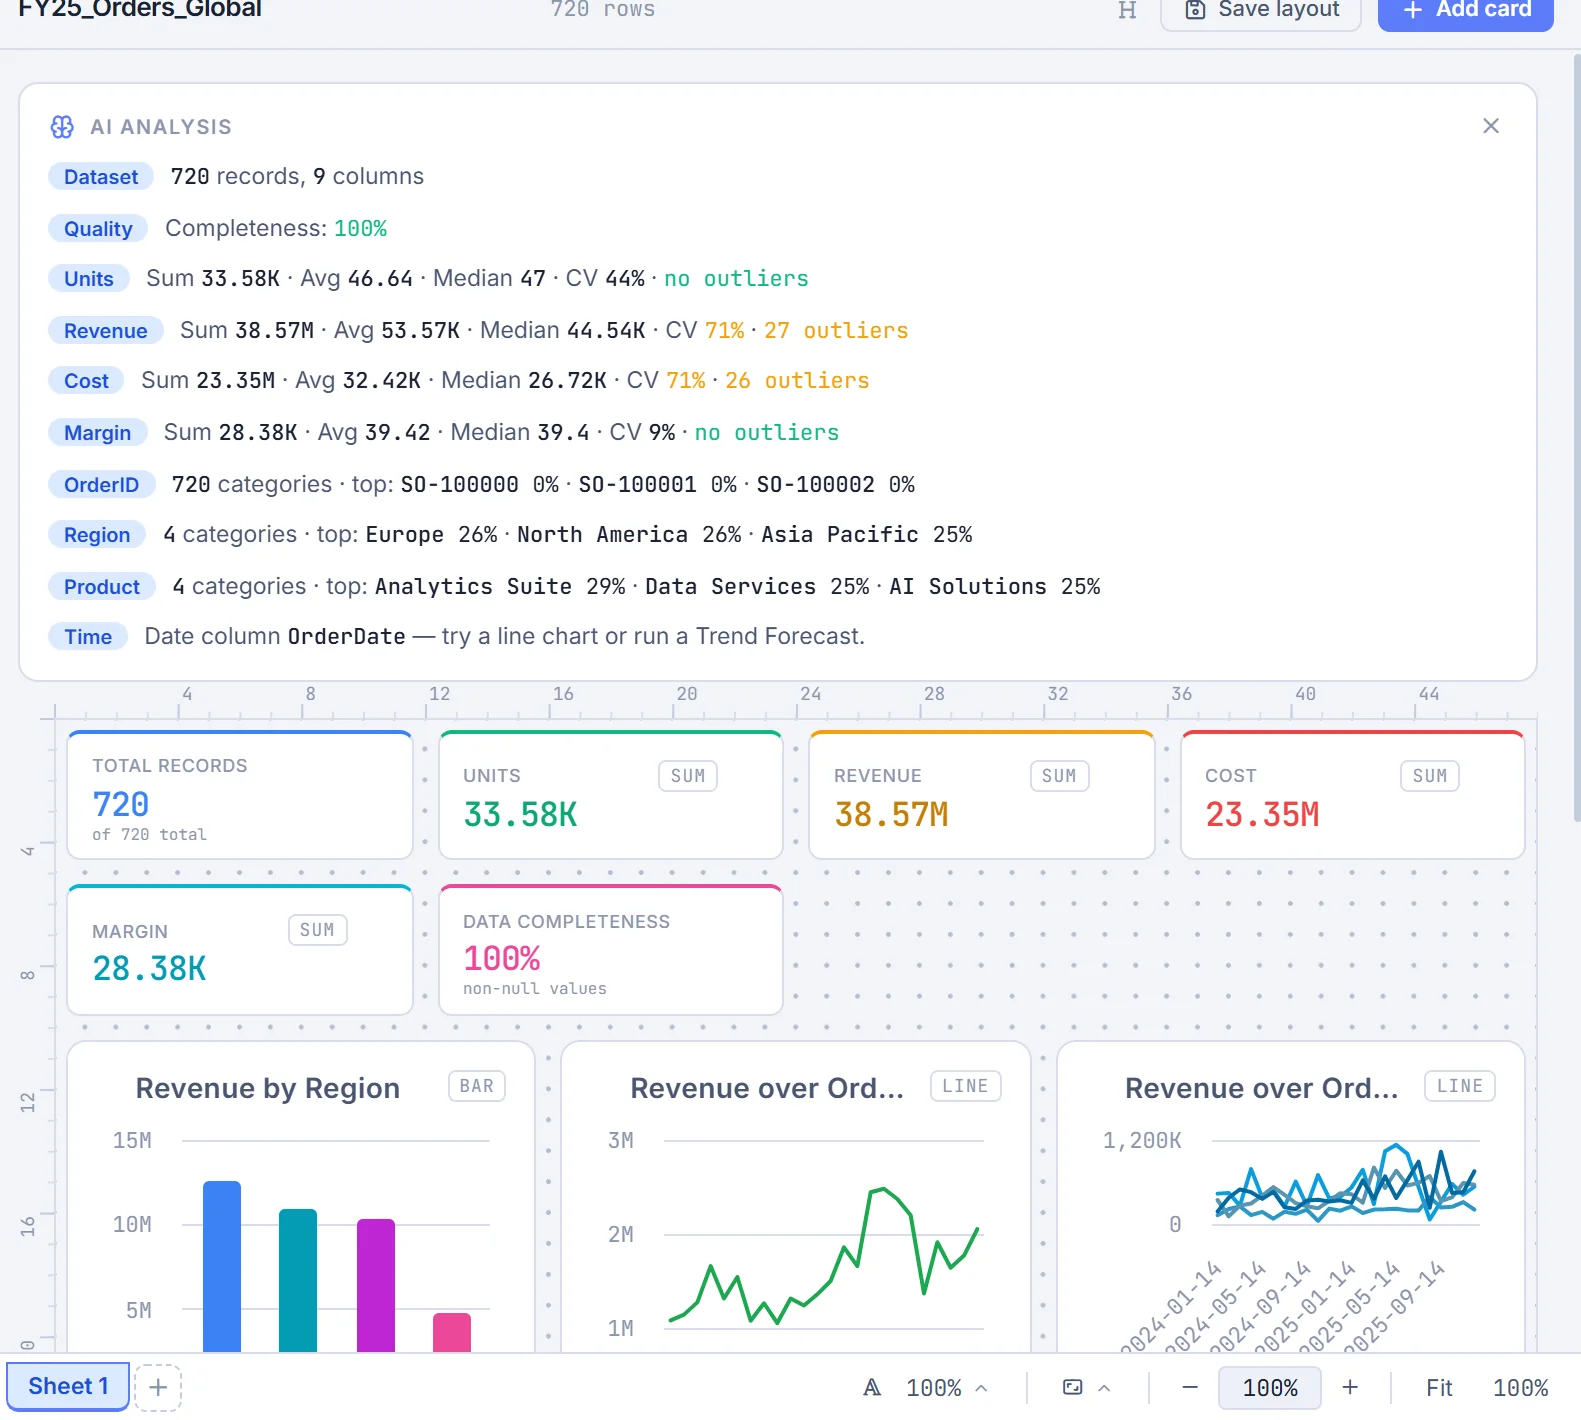
AI read of every columnKPIs built for youCharts that fit the data
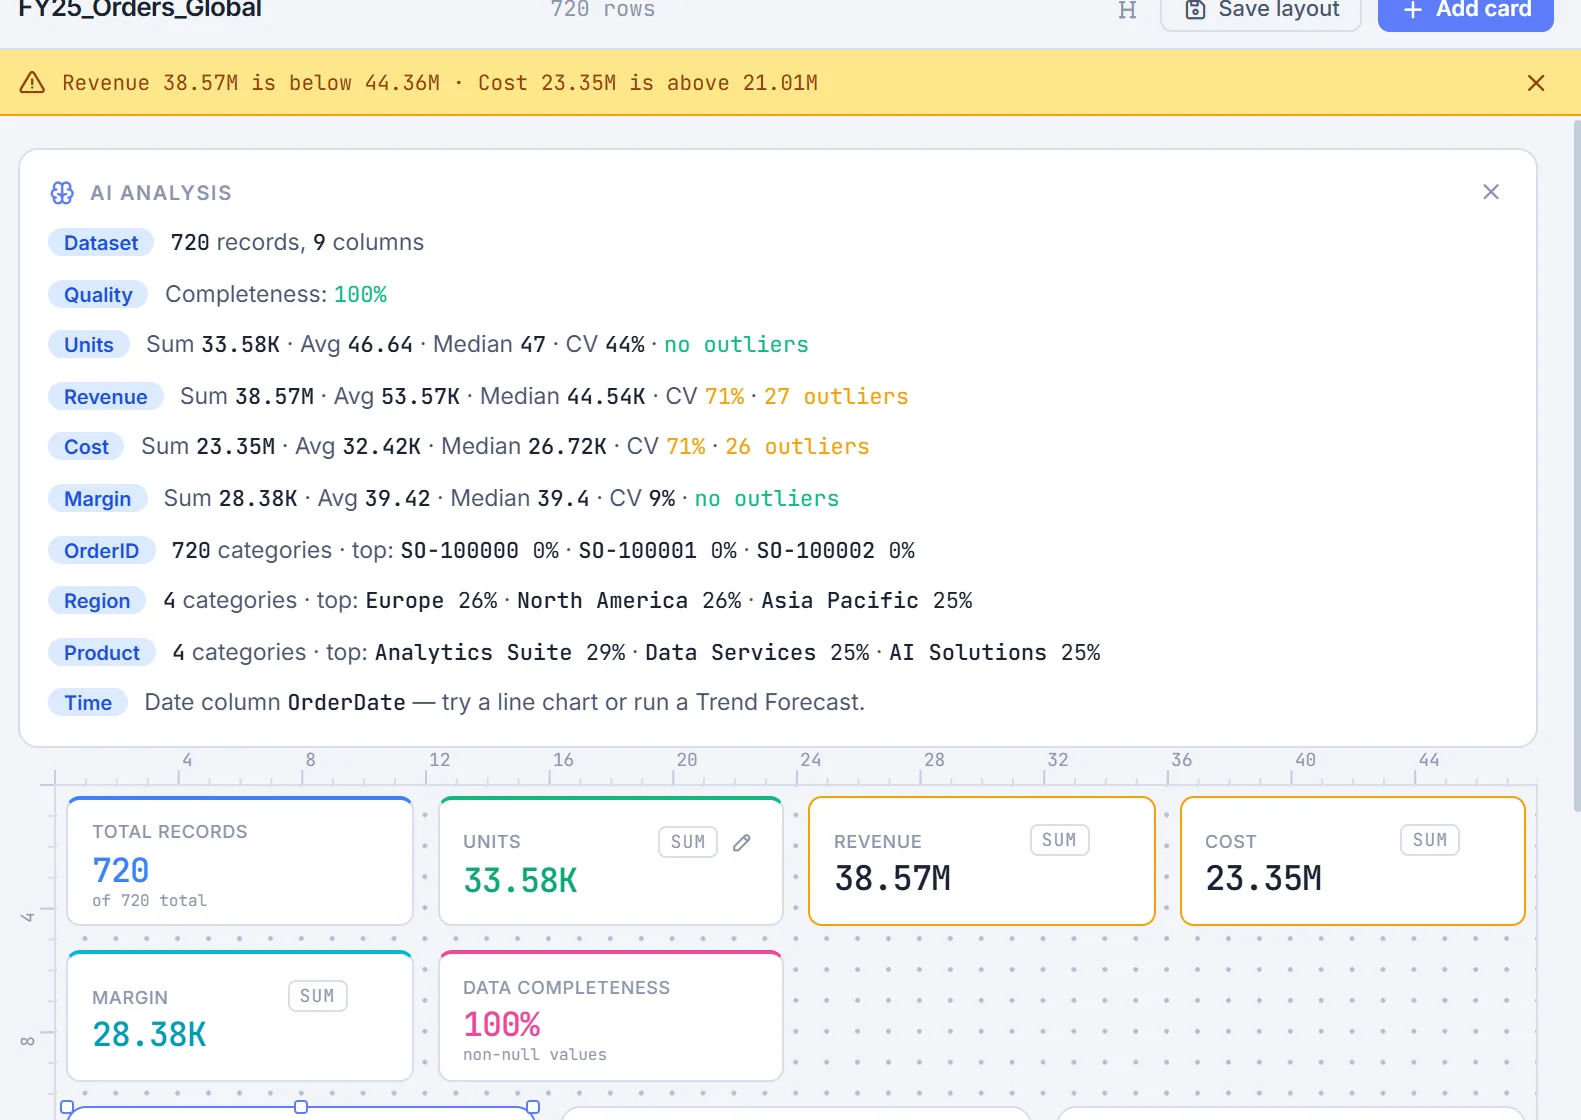
Drop a file. Get a dashboard.
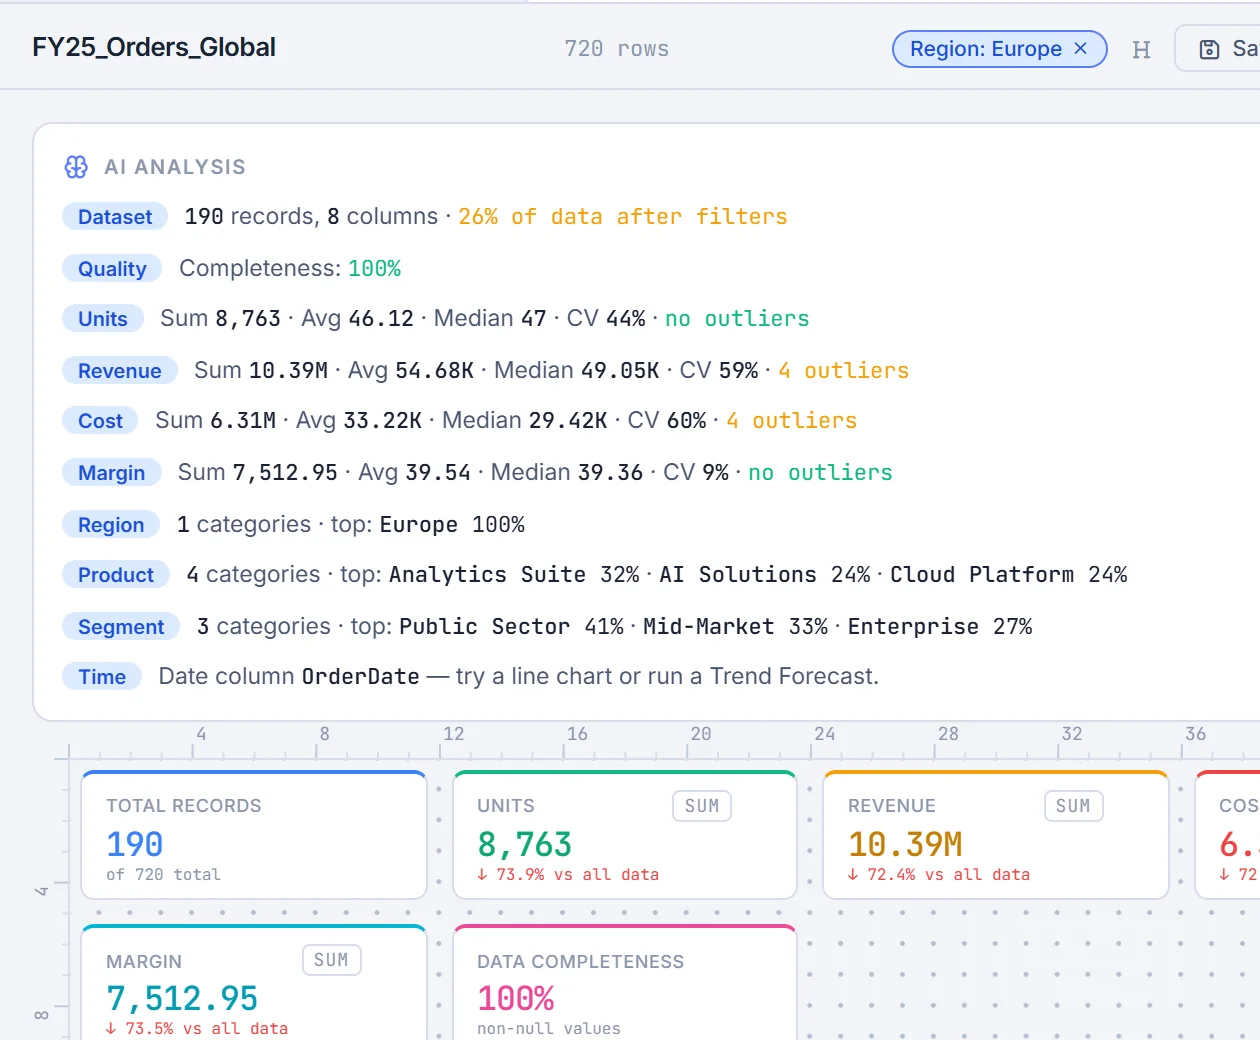
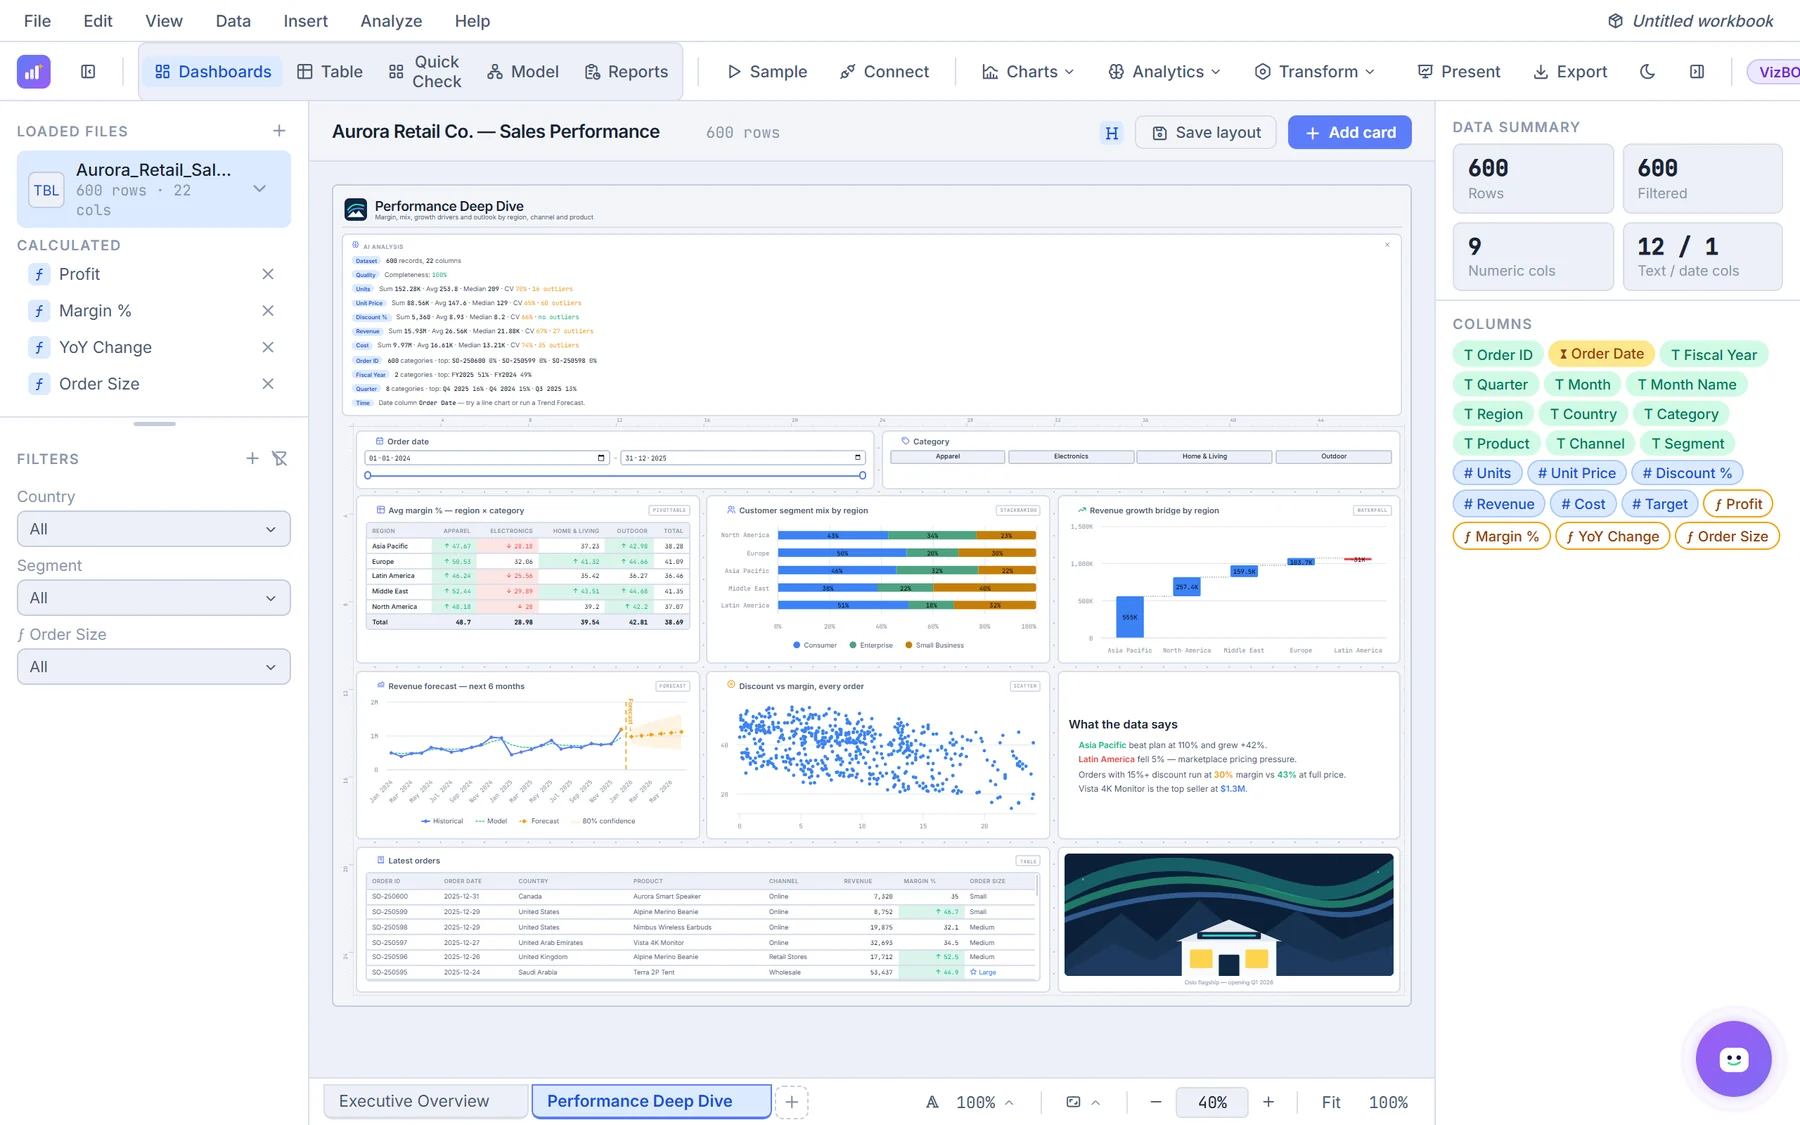
The moment data lands, QikAnalytix profiles every column, builds KPI cards and picks the charts that fit — trends over time, comparisons, shares.
12-rule auto-chart recommender
Data-quality score per load
Excel-style sheets and free canvas
Sample dataset to try in one click
Click any chart to cross-filter
Drill to the rows behind a bar
THE CLICK · Auto charts
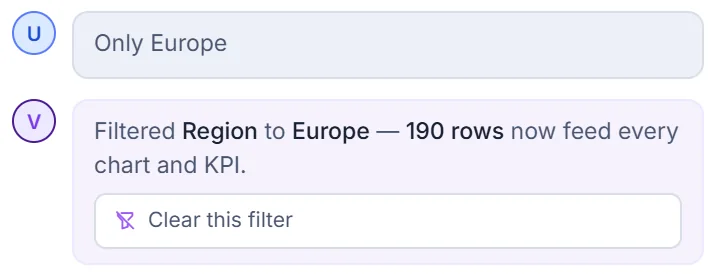
“Only Europe”Every KPI followsWorks offline
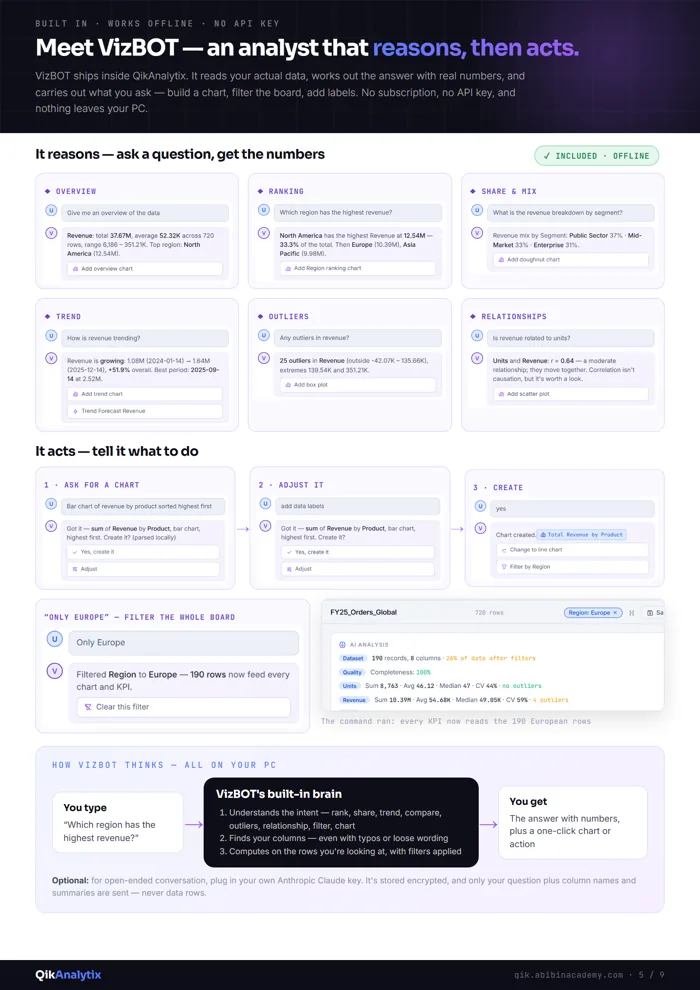
An analyst that reasons, then acts
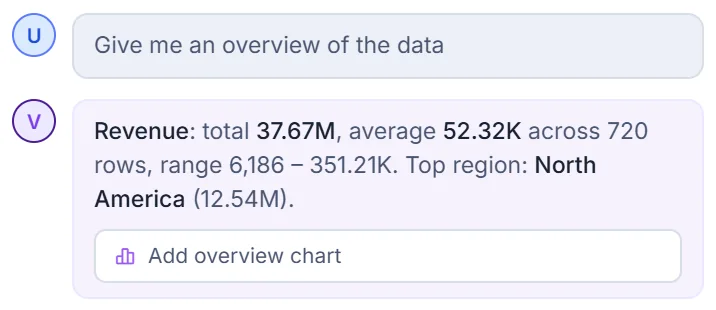
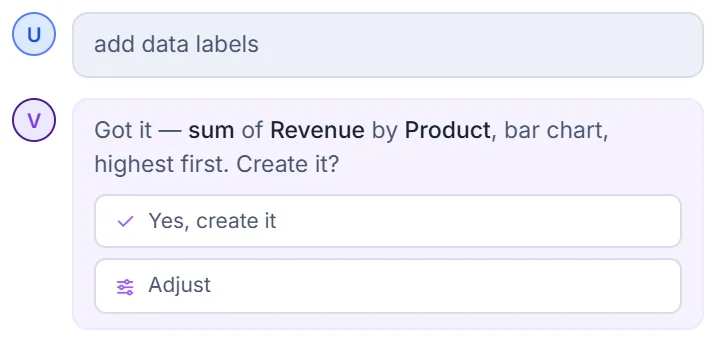
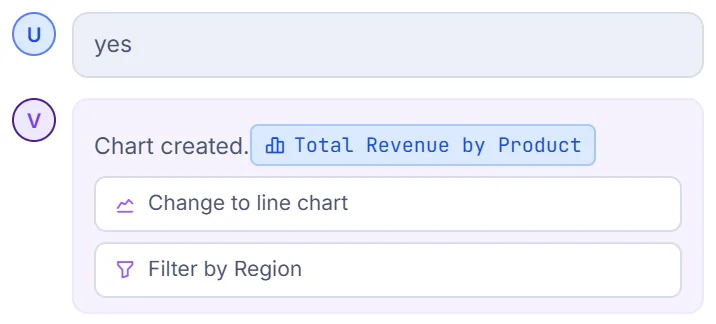
Ask in plain English. VizBOT reads your actual rows, answers with real numbers, then builds the chart, filters the board or adds labels — no subscription, no API key.
Overview, ranking, share & mix
Trends, outliers, relationships
Typo-tolerant column matching
Charts, filters and labels by phrase
Optional: plug in your own Claude key
Only names & summaries ever sent
THE CLICK · Ask VizBOT
−37.8% · real dropDrivers, ranked by share
Ctrl+click any spike. Get the why.
It names the change against the previous period, checks it's a real anomaly, then shows which segments actually drove it and what share of the swing each one carries.
Period-over-period deltas
z-score anomaly check
Segment drivers with share
Cross-measure correlation
Computed locally
No API key, no network
THE CLICK · Ctrl + click
0% → 91% in one clickPreview every fix
Fix messy data in one click
One scan finds what's broken and counts every case. Preview any fix, or fix them all at once. Keep originals and write fixes to new columns if you like.
Empty cells & duplicate rows
Whitespace & case variants
Numbers / dates stored as text
Every fix can be undone
Recorded as editable steps
Source file never touched
THE CLICK · Fix all
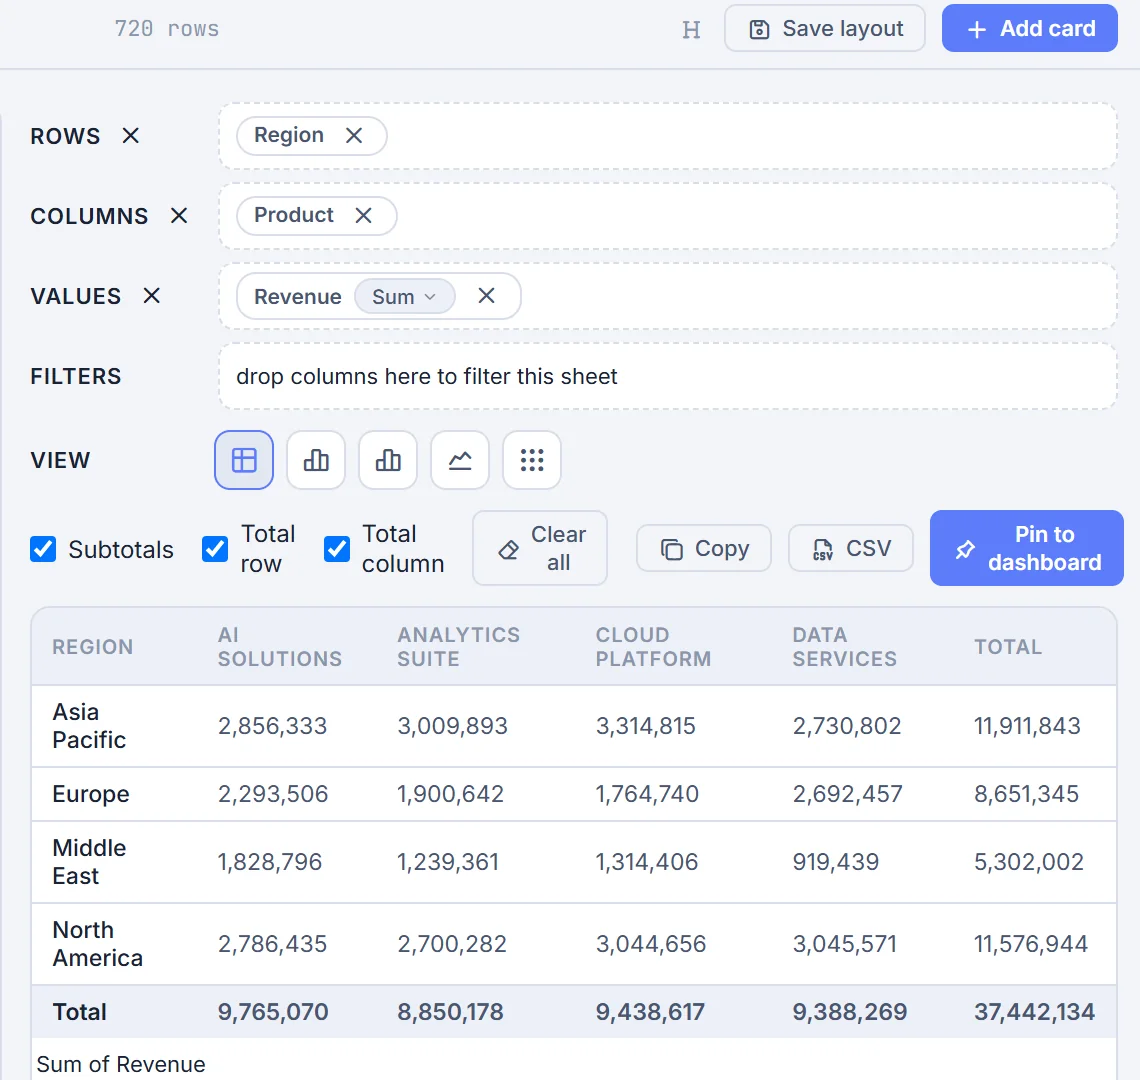
Drag to Rows / Columns / ValuesPin as a live card
Pivot tables by dragging
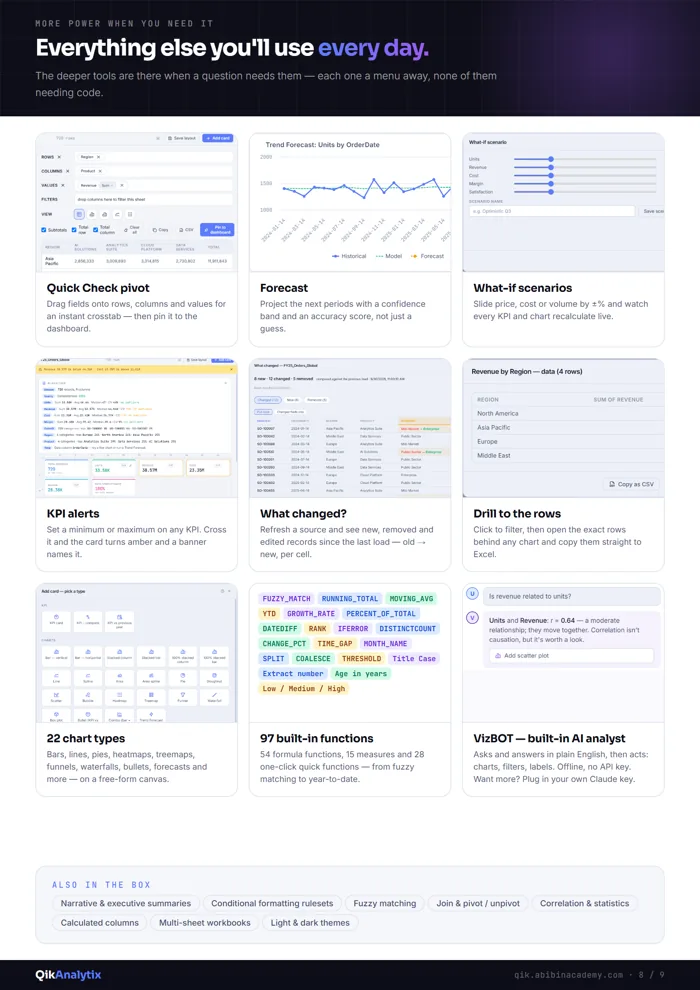
Drop fields onto Rows, Columns and Values for an instant crosstab — subtotals and grand totals included — then pin it to the dashboard as a live-linked card.
Subtotals & grand totals
Sum, average, count, distinct
Copy to Excel or CSV
Stays in sync with filters
Pivot & unpivot datasets
Join on a shared key
THE CLICK · Pin to dashboard
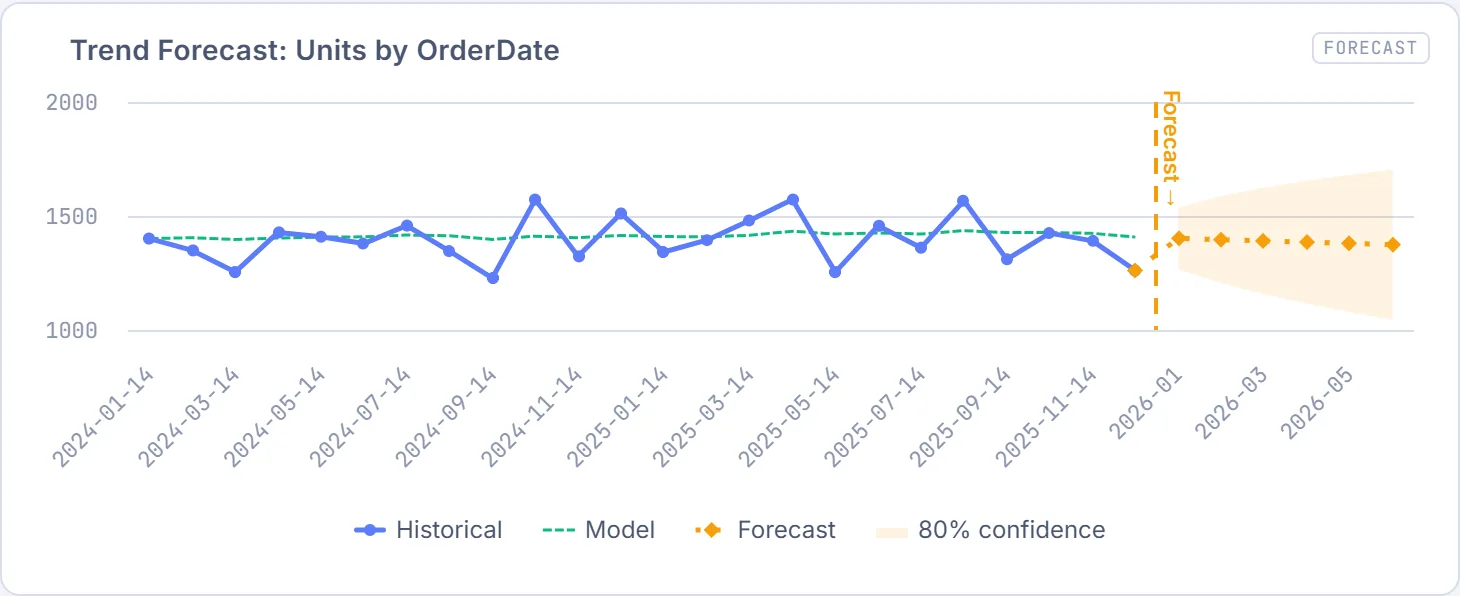
80% confidence bandMAPE accuracy score
Project the next quarters. Model the plan.
Run a Holt forecast and see the projection with its confidence band and accuracy score. Then slide price, cost or volume ±% and watch every KPI and chart recompute live.
Holt smoothing forecasts
Accuracy scoring
What-if sliders on any measure
Amber scenario banner
Correlation matrices
Up to 21 statistics per column
THE CLICK · Trend forecast
Threshold crossedCard turns amber
Know the moment a number moves
Set a minimum or maximum on any KPI — cross it and the card turns amber and a banner names it. Refresh a source and see new, removed and edited records, old → new, per cell.
Min / max KPI thresholds
What changed? per-cell diff
New & removed records
Conditional formatting rulesets
Narrative & executive summaries
Copy changes straight to Excel
THE CLICK · Set alert
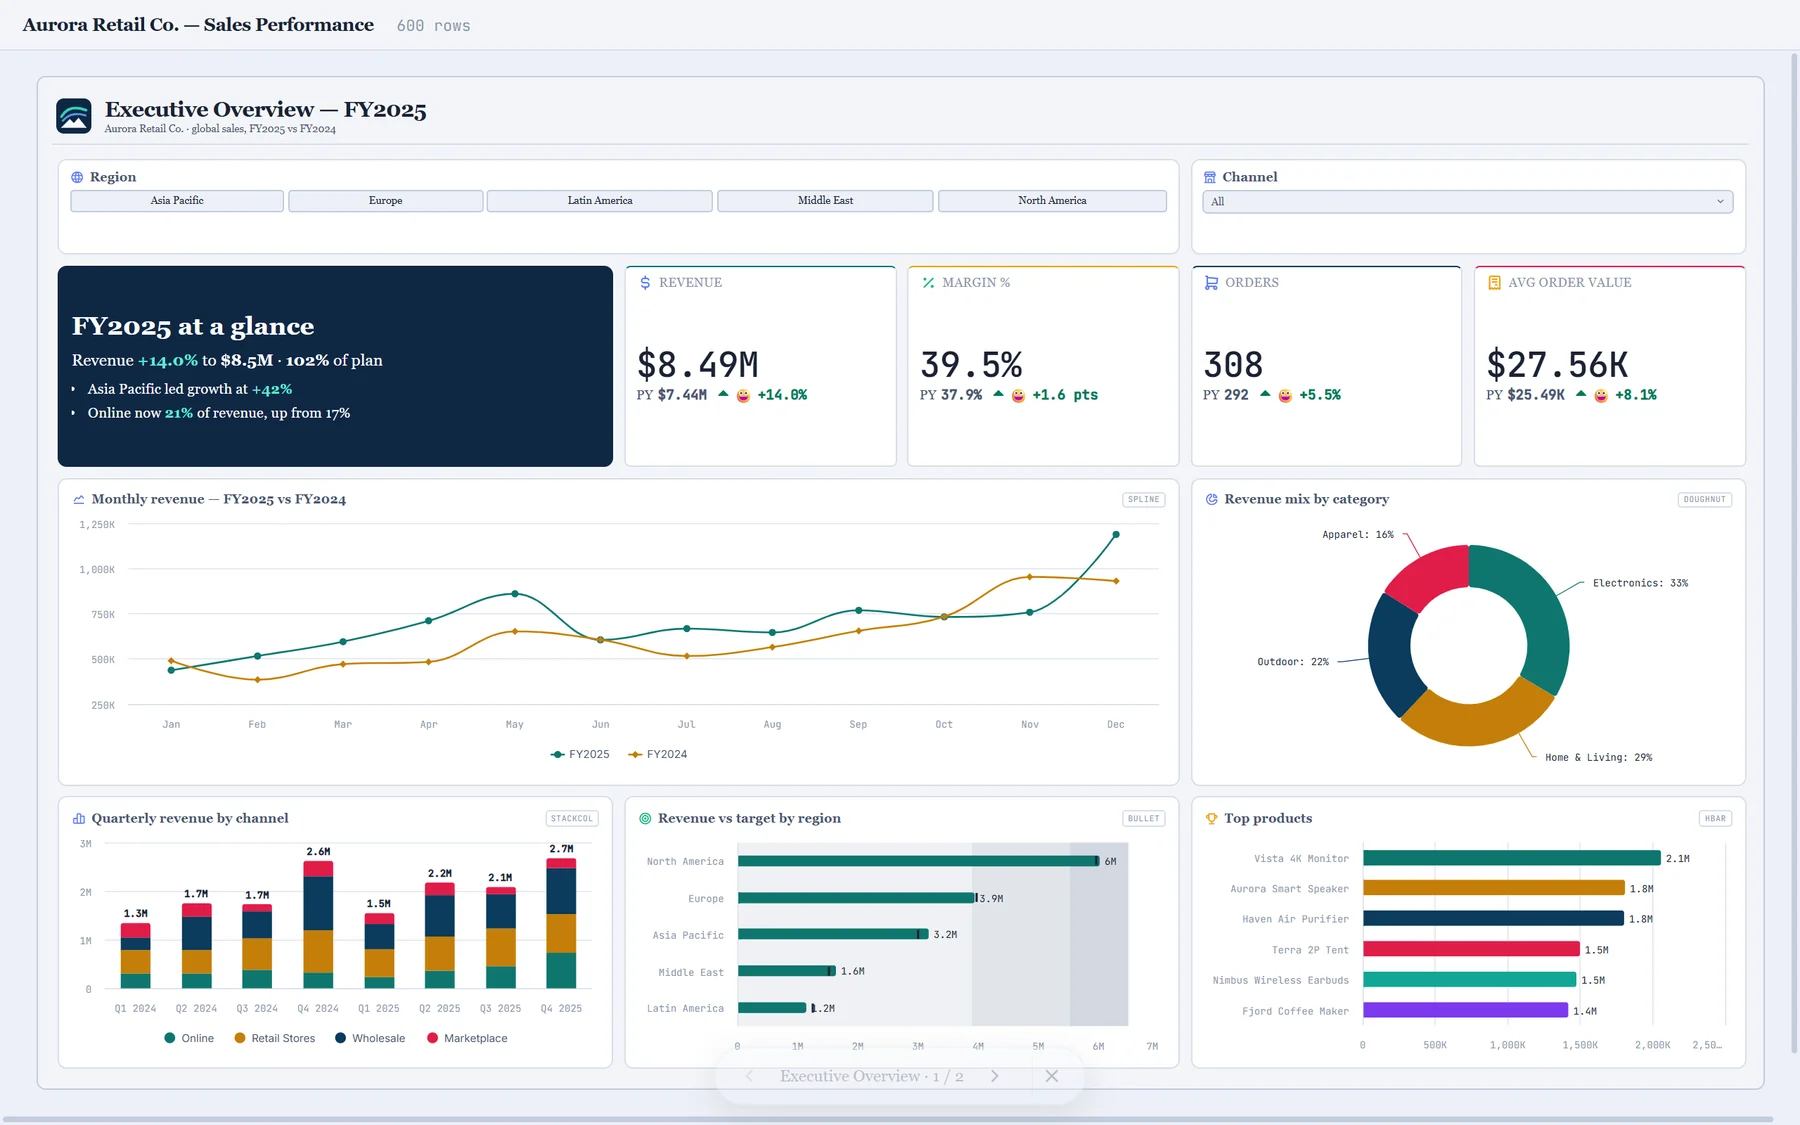
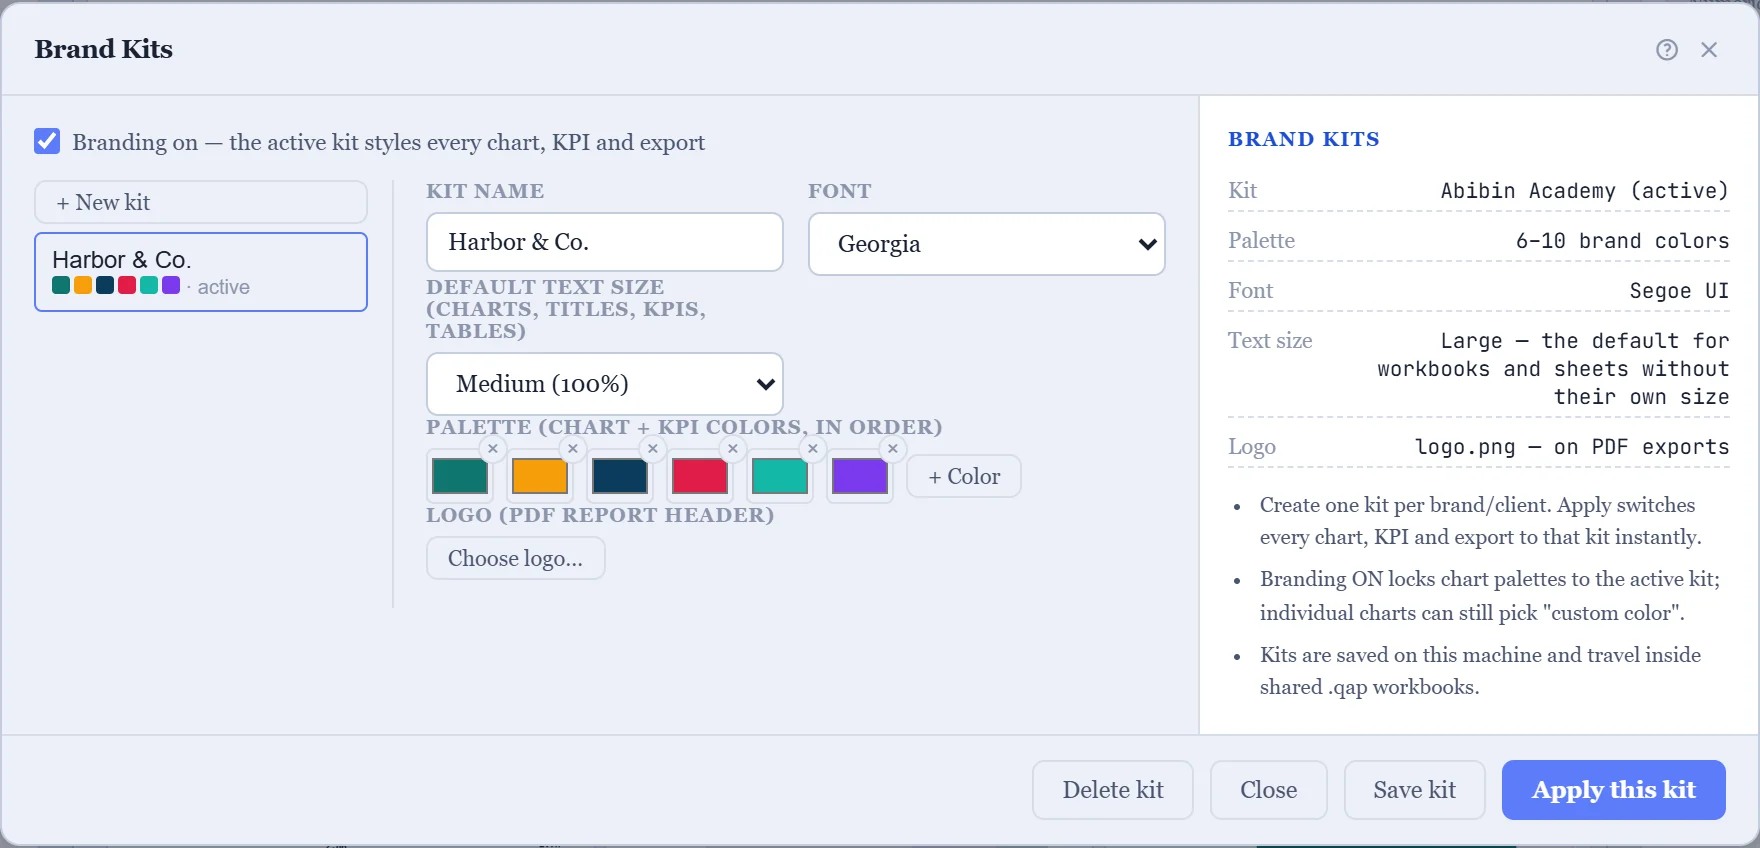
Your paletteYour fontLogo on every PDF page
Your colours, font and logo — everywhere
Save a Brand Kit once and apply it in a click. Every chart, KPI and export switches to your look. Keep one kit per client or department.
4–10 brand colours
Heading & body fonts
Logo on PDF report headers
Kits travel with the workbook
Light & dark themes
Per-client kits
THE CLICK · Apply this kit
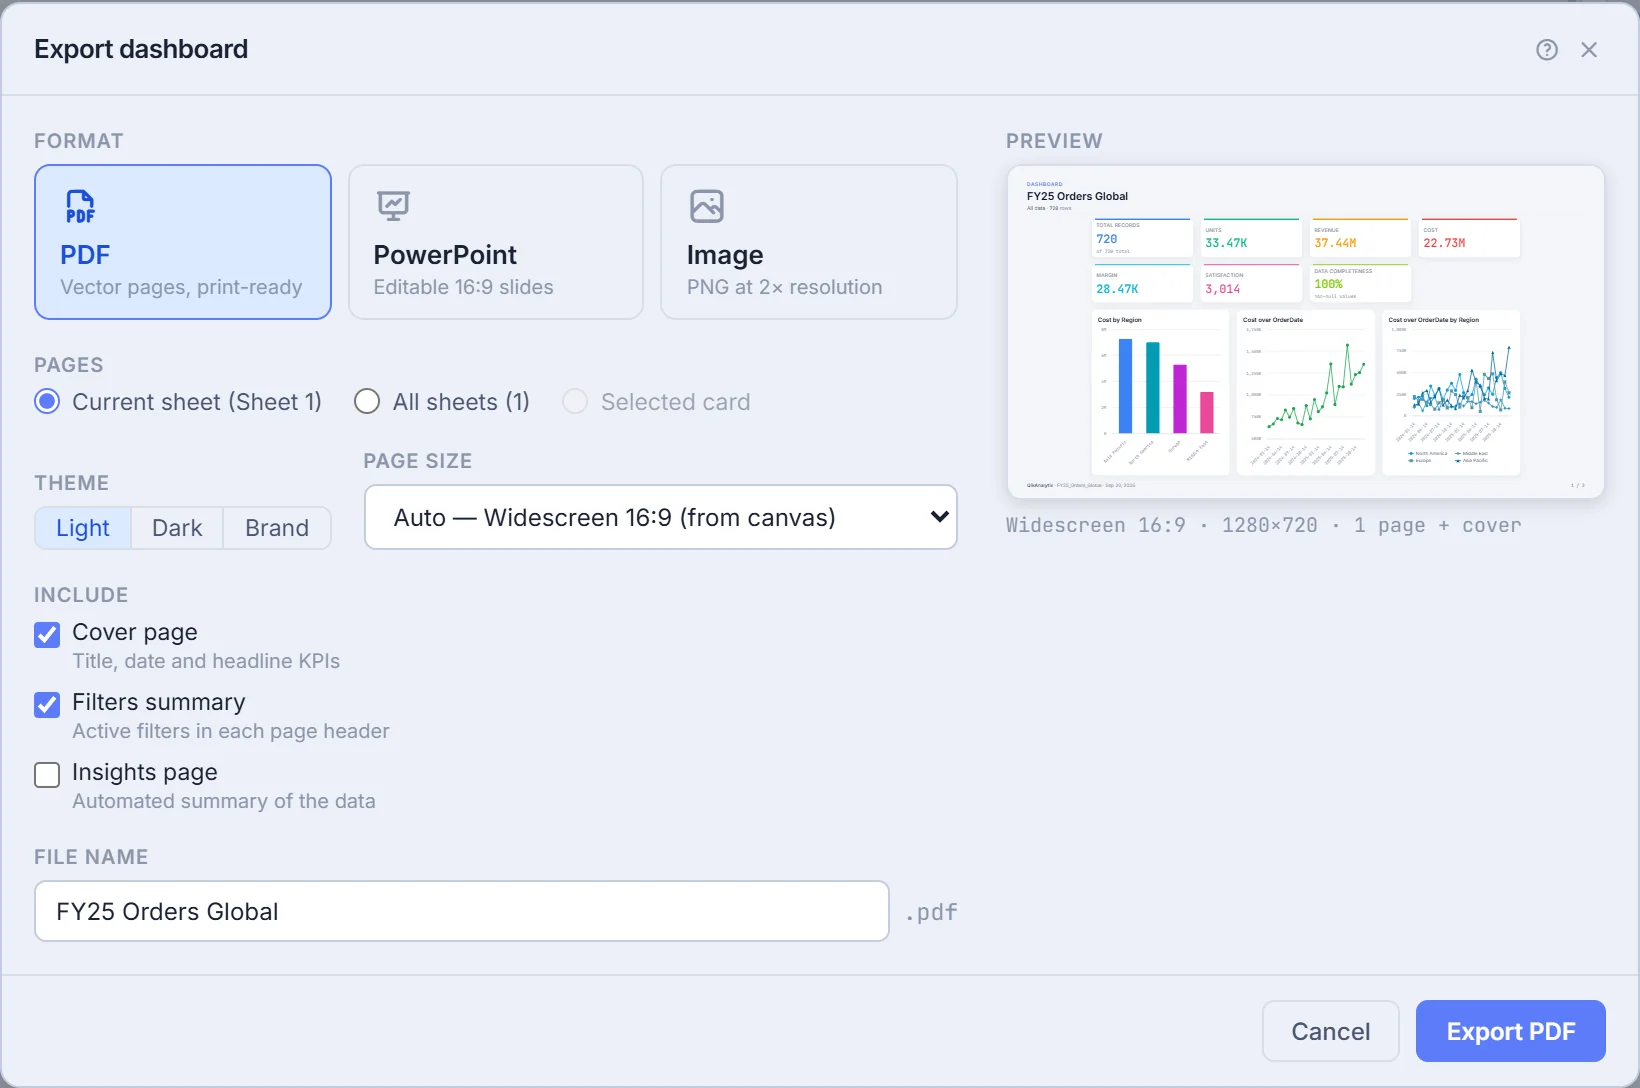
PDF · PowerPoint · ImageCover & filter summary
From dashboard to boardroom
One click turns the dashboard into a full-screen presentation — menus hidden, arrow keys between pages. Or send a branded multi-sheet PDF or PowerPoint pack.
Full-screen presenter mode
Multi-sheet PDF packs
PowerPoint export
Excel + CSV + chart PNGs
.qap workbooks — double-click to open
No server needed to share
THE CLICK · Present
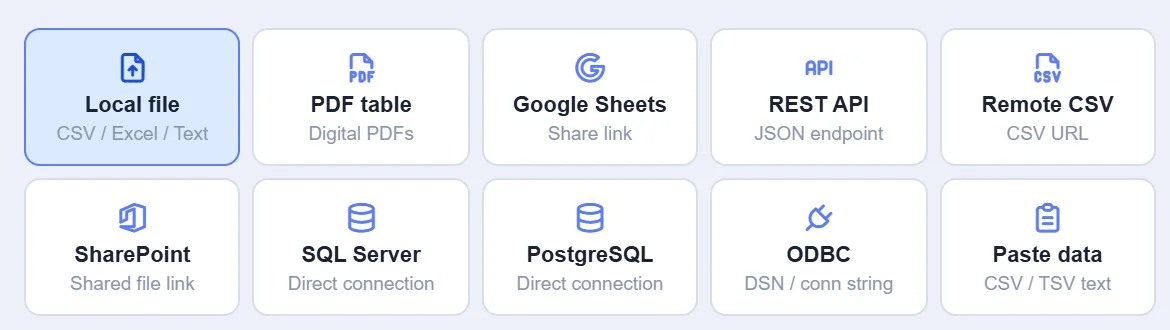
Ten sources, one picker
Connect what you already use
SQL Server, PostgreSQL and ODBC connect natively — ODBC reaches Oracle, DB2, MySQL and Access. Plus Google Sheets, REST APIs, remote CSV, SharePoint links, PDF tables, local files and paste.
Native SQL Server & PostgreSQL
Any 64-bit ODBC driver
SharePoint & OneDrive links
PDF table extraction
Passwords never written to disk
Edit or reload any time
THE CLICK · Connect
Built in · works offline · no API key
Meet VizBOT. It reasons, then acts.
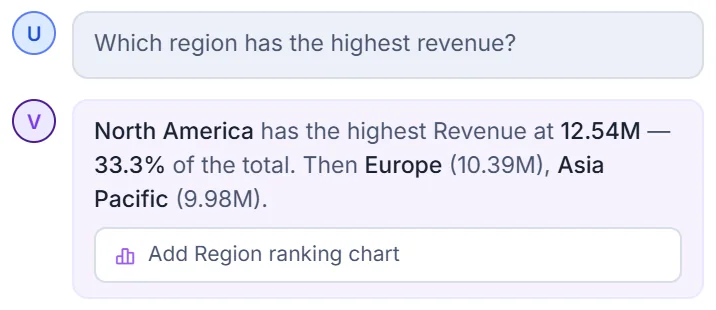
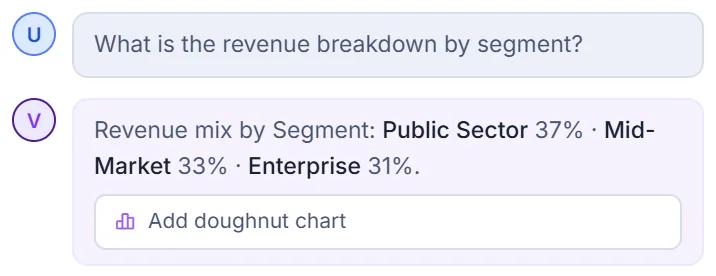
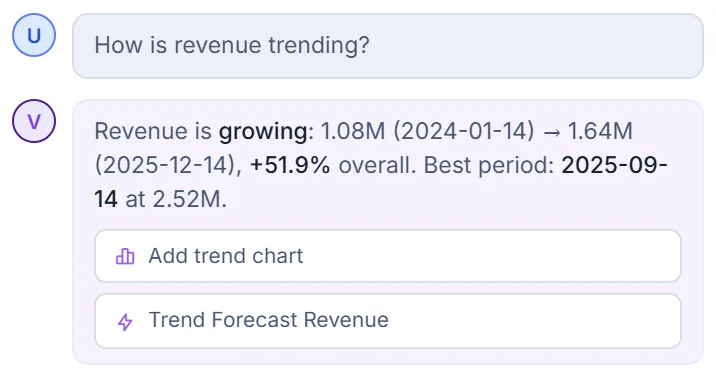
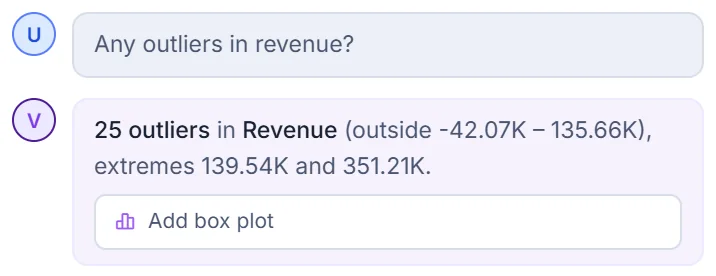
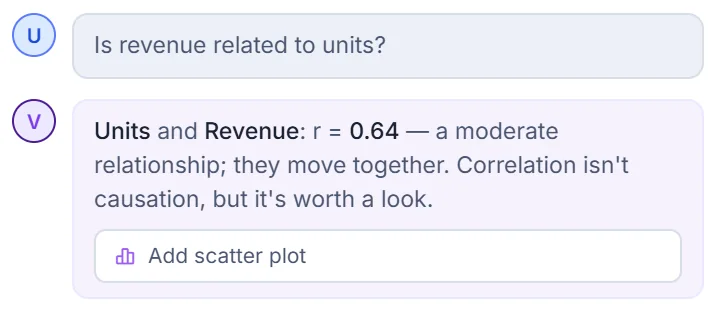
VizBOT ships inside QikAnalytix. It reads your rows, works out the answer with real numbers, and carries out what you ask. These are unedited answers from the app.
OVERVIEW
RANKING
★★★★★
0
API keys, subscriptions or uploads needed. The reasoning runs on your PC.
SHARE & MIX
TREND
OUTLIERS
RELATIONSHIPS
ACT · FILTER
ACT · BUILD A CHART
ACT · ADJUST
ACT · CREATE
You type
“Which region has the highest revenue?” — loose wording and typos are fine.
VizBOT's built-in brain
Finds the intent and your columns, then computes on the rows you're looking at, filters applied.
You get
The answer with numbers, plus a one-click chart or action. Optional own-key mode never sends data rows.
Who it's for
Built for the people who do the reporting
Finance, operations, sales, consulting, HR, schools and leadership teams — anyone who owns a number and has to explain it.
Why QikAnalytix
How we're different
We're not another cloud BI subscription. We put the whole journey — clean, model, chart, ask, report, present — on the PC you already have.
Your data never leaves
Every row — loading, cleaning, models, charts, forecasts and reports — runs locally. Nothing is uploaded, so there's nothing for security to review.
Works fully offline
One licence check at activation, then it runs offline. A lost network never locks a licensed user out.
AI included — no API key
VizBOT and trend explanations reason on your PC. Add your own Claude key only if you want open-ended conversation.
Dashboards and reports, together
Explore on a dashboard, then send an Excel-grade paginated report — one tool, not two, so the work isn't done twice.
Non-destructive by design
Every transform runs on an in-memory copy. Your source files are never rewritten, and every step can be edited or undone.
If you can use Excel, you can use this
Menus, drag-and-drop and plain English. No formulas to learn, no training course, no data engineer.
Transparent, honest pricing
$5.99 per user per month, billed annually — against $50–$100+ for typical cloud BI, before the data engineer.
New in 1.8
When one spreadsheet isn't enough
New · Data model & ETL
Combine sources. No code.
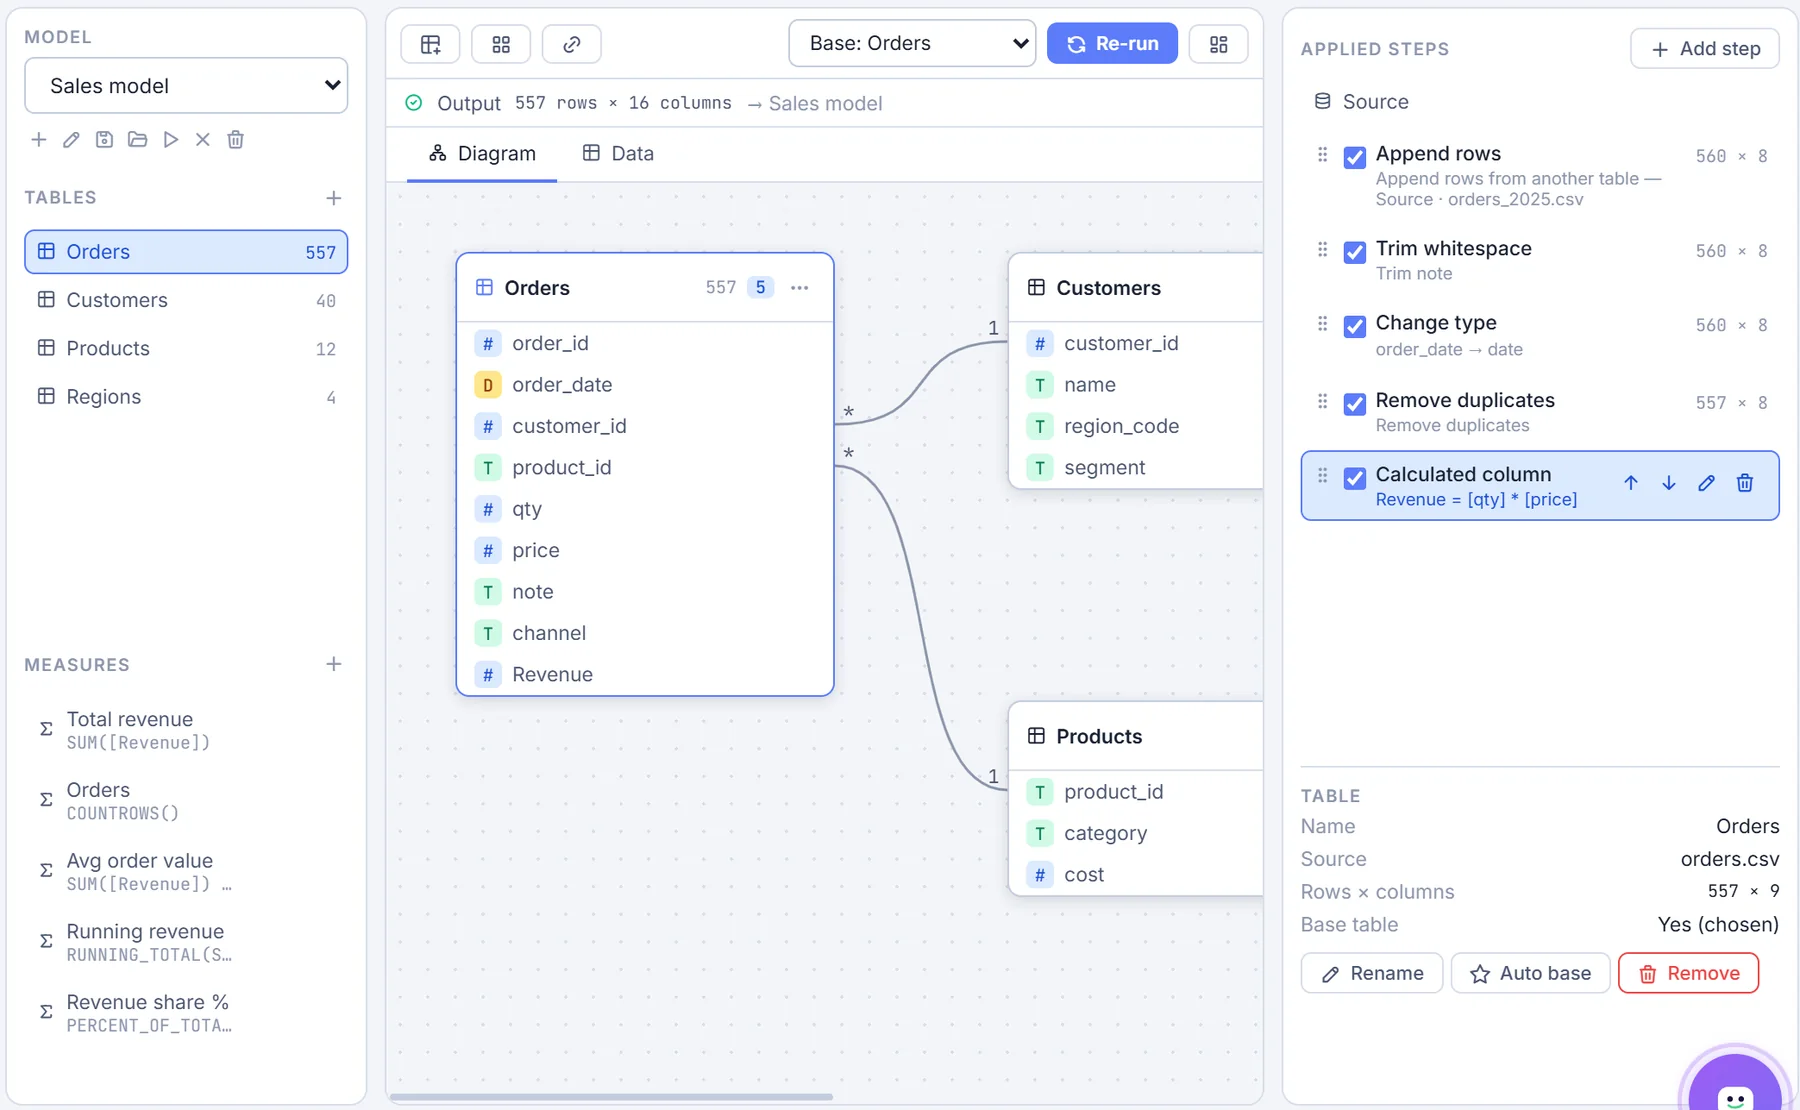
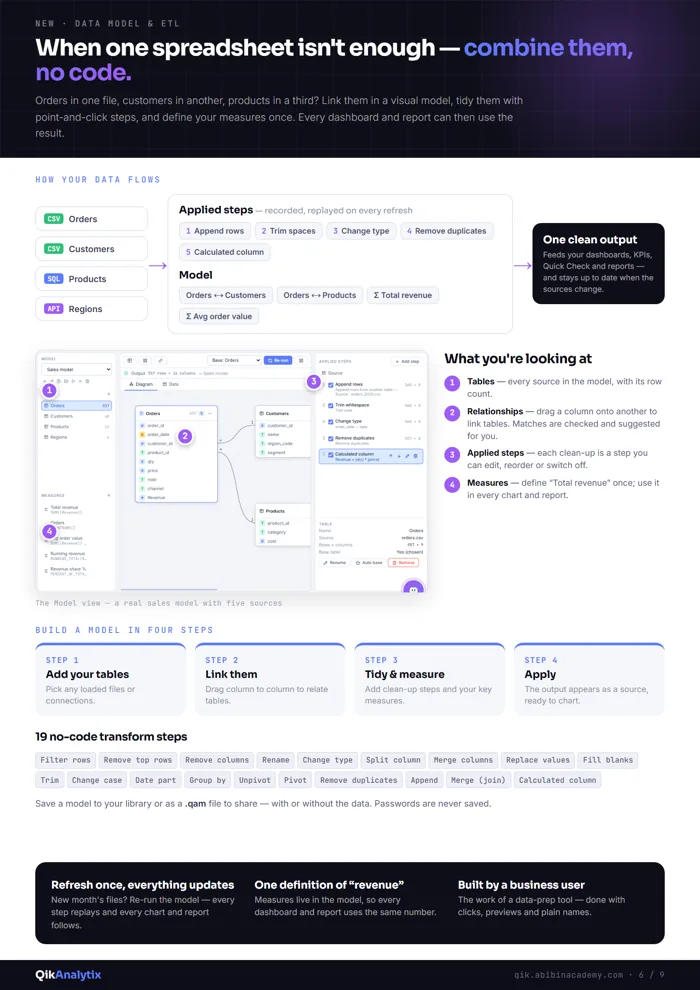
Orders in one file, customers in another, products in a third? Link them in a visual model, tidy them with point-and-click steps, and define your measures once. Refresh — every step replays and every chart follows.
AppendMerge (join)Split columnChange typeFill blanksGroup byUnpivotRemove duplicates+ 11 more steps
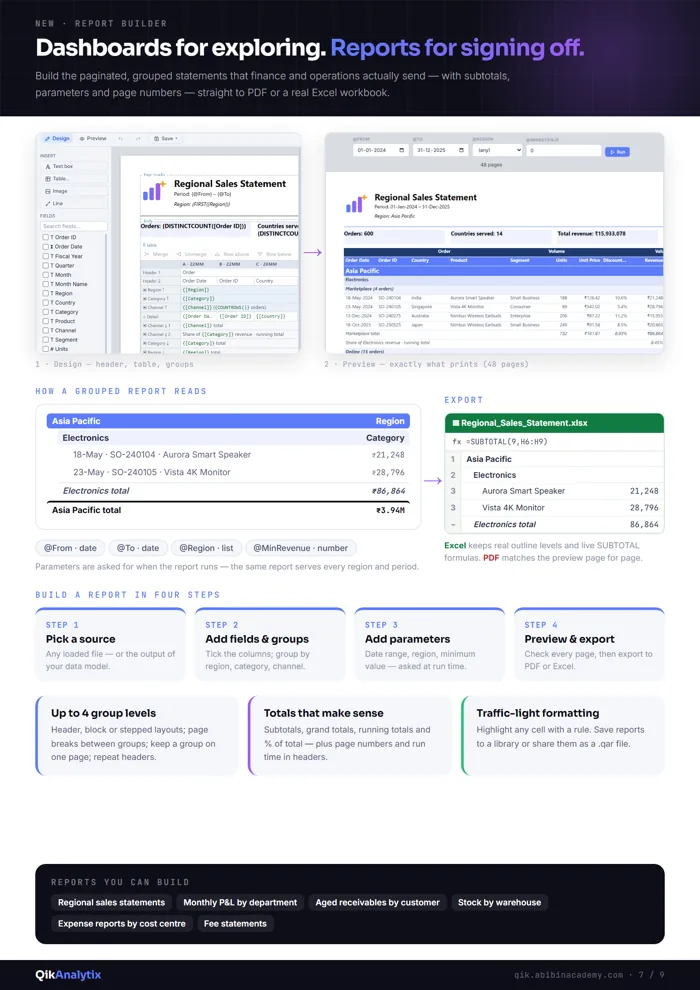
Dashboards for exploring. Reports for signing off.
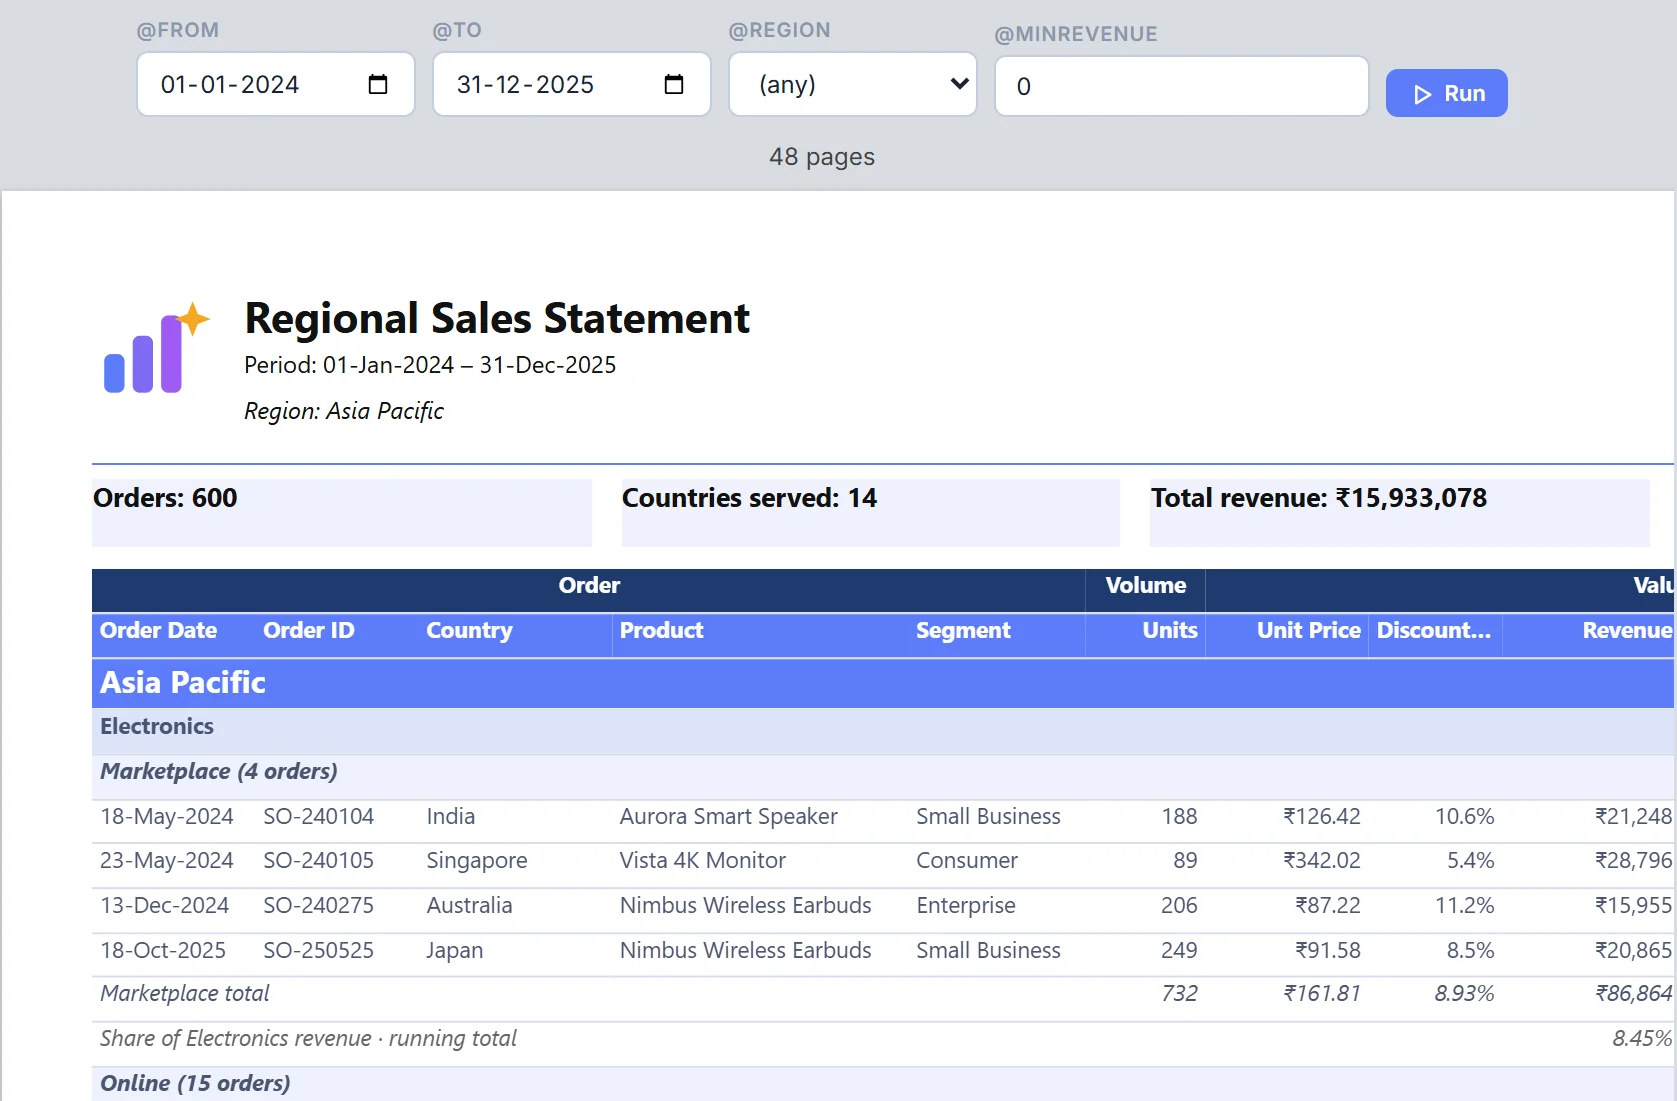
Build the paginated, grouped statements finance and operations actually send — subtotals, parameters and page numbers — straight to PDF or a real Excel workbook with live SUBTOTAL formulas.
Up to 4 group levelsRun-time parametersRunning totals% of totalTraffic-light rules.qar sharing
Windows 11 laptop · synthetic order book · 9 columns. Loading is the slow part — you pay once, up front, then it stays responsive.
500,000 rows
▲+14.0% revenue vs PY0.29 s filter at 100K rows●15 MB at 100K rows
rows to a full dashboard
500K
load → dashboard
4.7s
cross-filter
0.49s
memory at 500K
50MB
Rows
Load → dashboard
Cross-filter
Table view
Pivot
Memory
100,000
1.1 s
0.29 s
0.25 s
0.36 s
15 MB
250,000
1.9 s
0.34 s
0.22 s
0.22 s
28 MB
500,000
4.7 s
0.49 s
0.28 s
0.48 s
50 MB
Brochure 2026
Take the whole story with you
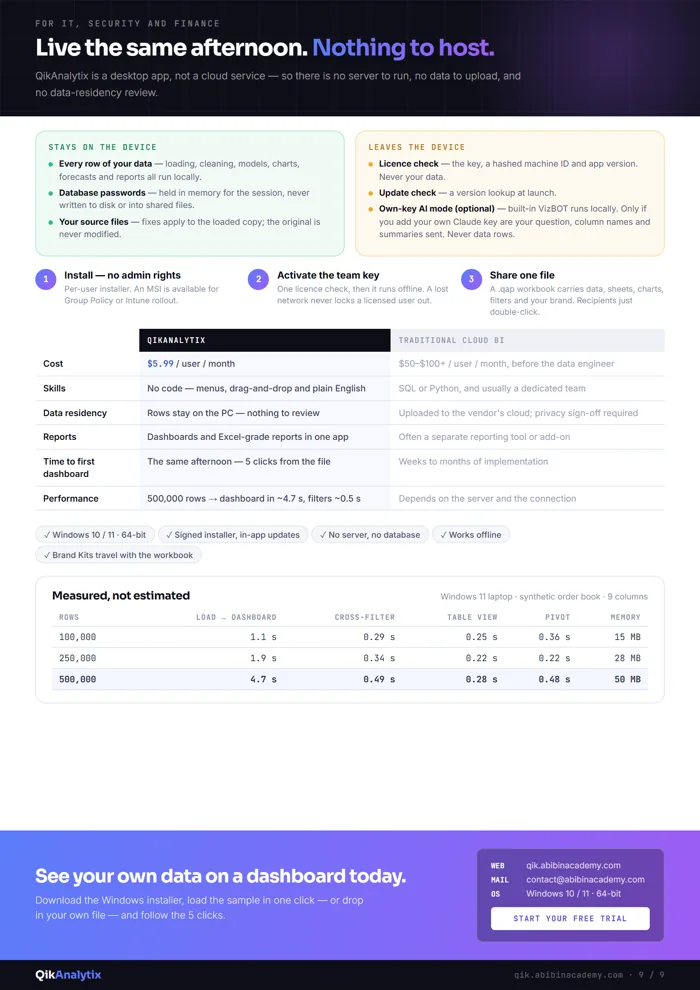
Nine pages for leadership, IT, security and finance — the 5-click journey, VizBOT, the data model, Report Builder, what stays on the device, and the measured performance table.
No. Files and database results are processed and stay on your machine. The only optional external call is VizBOT's own-key AI mode (your question, column names and summaries — never rows) — and VizBOT works fully offline without it.
Does it need internet?
Once, to activate your license key. After that it runs fully offline, with a silent re-check about every 30 days that never locks you out while offline.
Do I need an AI subscription or API key?
No. VizBOT and “Explain this trend” are built in and reason on your PC. If you want open-ended conversation you can plug in your own Anthropic Claude key — it's stored encrypted with Windows DPAPI.
What can I load?
CSV and Excel files, PDF tables, Google Sheets, SharePoint/OneDrive share links, REST APIs, remote CSVs, pasted data — and live SQL Server, PostgreSQL or any ODBC source (Oracle, DB2, MySQL, Access).
Can I move my license to a new machine?
Yes — licenses are machine-bound but transferable. Change the key in-app from About → Change license key, or contact support to release a binding.
Does it modify my source files?
No. Every clean, join, pivot and calculated column runs on an in-memory copy — your CSV, Excel and database data are never written back. The cleaning wizard can even keep originals and add the fixes as new columns.
How do the connectors handle credentials?
Your database password is never written to disk at all — it is held in memory for the session and re-entered next time. Recent connections store the connection details only, never the password. The one secret we do persist is your optional Anthropic API key, encrypted at rest with Windows DPAPI in the privileged process, never in the UI layer.
What leaves the machine, exactly?
Three things, none of which carry your data: licence validation (your key, a hashed machine fingerprint and the app version) at activation, at launch and on a background re-check; an update check at launch; and — only if you opt in by adding an Anthropic API key — VizBOT's AI mode, which sends your question and your column names, never data rows. Cloud sources like Google Sheets or a REST endpoint are fetched only when you ask for them.
How many rows can it handle?
Measured, not guessed: 500,000 rows reaches a full dashboard in about 4.7 seconds, after which filtering and pivoting run in roughly half a second each. At 100,000 rows it's about 1.1 seconds to load and 0.3 seconds to filter. Measured on Windows 11 with a synthetic order book; file parsing time isn't included, and an older laptop will be slower. If it matters for an RFP, ask us to run the benchmark on your hardware with your file.
How do teams roll it out?
Install per user with no admin rights, or push the MSI through Group Policy or Intune. Activate the team key once, then share .qap workbooks — data, sheets, charts, filters and your brand in one file colleagues just double-click.
Contact
Talk to a human
Questions, a live demo, or volume licensing — reach us the way that suits you. We usually reply within a business day.
 AI read of every columnKPIs built for youCharts that fit the data